
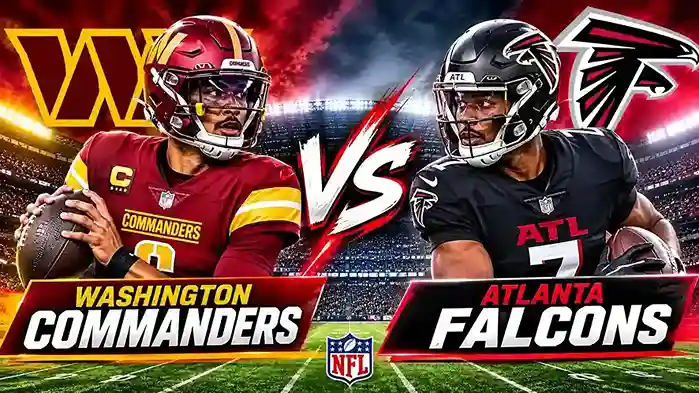
A 34-27 final tells you which sideline celebrated. It tells you almost nothing about how the game was actually won. The Washington Commanders vs Atlanta Falcons match player stats from their latest meeting show one offense that carved up the field through the air, another that found its best moments on the ground, and several individual performances that never reached the highlight reels.
This guide goes through every major category: passing, rushing, receiving, defense and special teams. The numbers come from verified ESPN and Pro-Football-Reference box scores. You will also find a head-to-head comparison, context from the previous meeting, and the newest updates on where both teams stand heading into their next game.
Why This Commanders vs Falcons Matchup Deserved a Closer Look
These two franchises are not old-school rivals. Even so, their recent meetings have felt far more competitive than a routine regular-season game. Their last two encounters were both decided by a single score: Washington won 30-24 in overtime in late December 2024, and Atlanta answered with a 34-27 victory at Mercedes-Benz Stadium on September 28, 2025.
That second game carried plenty of storylines. Both clubs left the afternoon at 2-2. Washington head coach Dan Quinn was walking back into the building where he spent six seasons as the Falcons’ head coach, and quarterback Marcus Mariota was facing the franchise he started 13 games for in 2022. Mariota was under center because Jayden Daniels did not play, which meant the Commanders were relying on an experienced backup against a young Atlanta passer eager to build on his breakout 2024 finish.
The result was a game full of momentum swings. Atlanta built a 31-16 lead late in the third quarter, Washington pulled within seven in the fourth, and a late field goal from each side closed out the scoring. Every player stat below should be read through that lens. Context matters as much as totals.
Quarterback Showdown: Passing Stats From the Commanders vs Falcons Match
The passing battle was the clearest dividing line between the teams. Both quarterbacks threw one interception and two touchdowns, which makes the headline numbers look similar. The efficiency underneath them was not close.
Michael Penix Jr.: A Near-Perfect Afternoon for Atlanta
Michael Penix Jr. completed 20 of 26 passes for 313 yards, two touchdowns and one interception. That works out to a 76.9 percent completion rate and roughly 12 yards per attempt, which produced a passer rating of 126.0. Those are elite efficiency numbers for any single game.
The signature moment was a 69-yard completion that went to running back Bijan Robinson, the longest play of the day for either offense. Penix also found Drake London for a 5-yard touchdown in the first quarter and tight end Kyle Pitts for a 7-yard score in the third. He was sacked only once for a loss of six yards, so Washington’s pass rush never got him off his spot for long.
The one blemish was the interception. It was costly, but it arrived in a game where Atlanta still converted six of twelve third-down attempts and held the ball for more than 34 minutes. Penix’s ability to stay on schedule is the main reason the Falcons’ offense never stalled for long.
Marcus Mariota: Quiet Production With Late Fireworks
Marcus Mariota finished 16 of 27 for 156 yards, two touchdowns and one interception, a passer rating of 84.8. His 59.3 percent completion rate and 5.8 yards per attempt tell the story of an offense that struggled to stretch the field. He was also sacked twice for nine yards.
His two scoring throws still mattered. The first was a 5-yard touchdown to Luke McCaffrey in the second quarter. The second was a 24-yard strike to Deebo Samuel in the fourth quarter that pulled Washington within seven, followed by a successful two-point conversion to Zach Ertz. Mariota also added 20 yards on the ground, which kept a few drives alive.
The larger problem was third down. Washington converted just one of eight attempts, and that single number explains why the Commanders’ possession time sat under 26 minutes. When an offense cannot sustain drives, even good quarterbacking in the fourth quarter cannot fully close the gap.
Jayden Daniels vs Penix: What the Previous Meeting Showed
The December 2024 meeting offers a useful contrast, because both starters played. Jayden Daniels threw for 227 yards and three touchdowns on 24 of 36 passing, with one interception, and added 127 rushing yards on 16 carries. Penix answered with 223 yards, one touchdown and one interception on 19 of 35.
Daniels was sacked five times in that game, yet his legs and late-game poise gave Washington the edge. His third touchdown pass, a 2-yard throw to Ertz in overtime, ended the contest. That game remains the best example of how different the two offenses look when Daniels is healthy: more rushing volume, more designed movement and a much higher ceiling on broken plays.
Rushing Attack: Who Controlled the Ground Game?
The rushing numbers told a split story. Atlanta carried the ball far more often, while Washington gained more yards per attempt. Neither average alone captures what happened.
Bijan Robinson and Tyler Allgeier vs Washington’s Committee
Bijan Robinson carried 17 times for 75 yards and a 14-yard touchdown. His rushing total was modest, but his overall impact was enormous: add his four receptions for 106 yards and he produced 181 scrimmage yards. Few backs in the league can swing a game from both the backfield and the slot like that.
Tyler Allgeier supplied the other half of Atlanta’s rushing tandem with 16 carries for 51 yards and a 15-yard touchdown in the final seconds of the third quarter. That score pushed the lead to 31-16 and forced Washington into catch-up mode. As a team, Atlanta ran 37 times for 128 yards, an average of 3.5 yards per carry. The totals look good, but the efficiency was merely average.
Washington had no single lead back. Chris Rodriguez Jr. ran seven times for 59 yards, though 48 of those yards came on one carry. His other six attempts produced only 11 yards. Jacory Croskey-Merritt added 47 yards on seven carries, and the team finished with 147 rushing yards on 22 attempts, a 6.7-yard average.
That average flatters Washington somewhat. A handful of explosive runs and Mariota’s scrambles padded the total, while consistent short-yardage success never appeared. Still, the Commanders found enough on the ground to stay within reach for most of the afternoon.
Receiving Corps: Big Plays, Reliable Hands and Missing Pieces
Atlanta’s pass catchers were the biggest beneficiaries of Penix’s efficiency. Washington’s group worked hard, but the offense could not generate enough volume to keep pace.
Drake London led all receivers with 8 catches on 10 targets for 110 yards and a touchdown. His longest reception covered 43 yards, and his size gave Washington’s defensive backs problems on contested throws all day. Kyle Pitts quietly turned in one of the most efficient lines of the game, catching all five of his targets for 70 yards and a score.
The most surprising receiving line belonged to Robinson, whose 106 yards on four catches included that 69-yard play. Darnell Mooney and Casey Washington contributed smaller roles, but the big three of London, Pitts and Robinson accounted for most of Atlanta’s production through the air.
For Washington, Deebo Samuel was the headliner. He caught all six of his targets for 72 yards and the 24-yard fourth-quarter touchdown, and he rushed three times for nine yards. Luke McCaffrey scored on his 5-yard reception and finished with two catches for 21 yards. Zach Ertz also caught two passes for 21 yards, Jaylin Lane had two for 18, and Tay Martin added a 14-yard grab.
Terry McLaurin, Washington’s usual top target, did not record a catch in the box score, and that absence shows up in the averages. Without a true vertical threat, Mariota’s yards per attempt dropped and the offense leaned on short, quick throws that were easier for Atlanta to contain.
Defensive Standouts: Sacks, Tackles and Hidden Pressure
Defense decided this game in subtler ways than the final score suggests. Neither team forced a turnover advantage, since each quarterback threw one interception and neither team lost a fumble. Instead, the defensive story was about situational success.
Atlanta’s defense got its two sacks in the form of Zach Harrison’s one-sack effort and another from a teammate, and it held Washington to a 1-for-8 mark on third down. Safety Jessie Bates III led the Falcons with seven tackles and set the tone in the secondary. That third-down dominance is the best single defensive statistic from the game.
Washington’s side was led by linebacker Bobby Wagner, who posted a game-high 10 tackles, four of them solo. Frankie Luvu recorded a sack, and the Commanders’ defense generated one more on Penix. They also held Atlanta to only 128 rushing yards on 37 carries. The problem was in coverage: Atlanta averaged 11.4 yards per pass play, and that explosiveness overwhelmed everything the front seven accomplished.
Penalties also nudged the balance. Washington was flagged six times for 50 yards compared with Atlanta’s five for 45. These were small margins, but in a seven-point game even a handful of yards in the wrong place can change a drive.
Special Teams: Kicking Decisions That Moved the Scoreboard
Special teams made this a closer game than it looked. Washington kicker Matt Gay was perfect in the scoring summary, converting four field goals from 43, 52, 41 and 42 yards. Those kicks produced 12 of Washington’s 27 points and kept the Commanders within striking distance after Atlanta’s third-quarter surge.
Atlanta’s John Parker Romo was equally reliable. He kicked field goals of 38 and 26 yards and converted all four extra-point attempts. His 26-yarder with under two minutes left stretched the Falcons’ lead to ten and forced Washington to need a touchdown and a field goal rather than one score.
The kicking battle was the clearest special-teams storyline. With both kickers reliable, the game came down to offense and defense, which made the quarterback gap even more important.
Head-to-Head: Washington Commanders vs Atlanta Falcons Match Player Stats Compared
The tables below put the key individual and team numbers side by side so you can see exactly where each team held the edge.
Player Stats From the Latest Meeting (September 28, 2025: Falcons 34, Commanders 27)
| Player | Team | Position | Key Stat | Total |
| Michael Penix Jr. | Falcons | QB | Passing Yards | 313 |
| Michael Penix Jr. | Falcons | QB | Passing TDs / INT | 2 / 1 |
| Marcus Mariota | Commanders | QB | Passing Yards | 156 |
| Marcus Mariota | Commanders | QB | Passing TDs / INT | 2 / 1 |
| Bijan Robinson | Falcons | RB | Rushing Yards | 75 |
| Bijan Robinson | Falcons | RB | Receiving Yards | 106 |
| Tyler Allgeier | Falcons | RB | Rushing Yards / TD | 51 / 1 |
| Chris Rodriguez Jr. | Commanders | RB | Rushing Yards | 59 |
| Drake London | Falcons | WR | Receiving Yards / TD | 110 / 1 |
| Kyle Pitts | Falcons | TE | Receiving Yards / TD | 70 / 1 |
| Deebo Samuel | Commanders | WR | Receiving Yards / TD | 72 / 1 |
| Bobby Wagner | Commanders | LB | Tackles | 10 |
| Jessie Bates III | Falcons | S | Tackles | 7 |
| Matt Gay | Commanders | K | Field Goals Made | 4 |
Team Stats Comparison
| Category | Commanders | Falcons |
| Total Yards | 294 | 435 |
| Passing Yards (net) | 147 | 307 |
| Rushing Yards | 147 | 128 |
| First Downs | 17 | 24 |
| Third-Down Conversions | 1 of 8 | 6 of 12 |
| Turnovers | 1 | 1 |
| Penalties | 6 for 50 yards | 5 for 45 yards |
| Time of Possession | 25:45 | 34:15 |
Player Stats From the Previous Meeting (December 29, 2024: Commanders 30, Falcons 24 in OT)
| Player | Team | Position | Key Stat | Total |
| Jayden Daniels | Commanders | QB | Passing Yards / TD | 227 / 3 |
| Jayden Daniels | Commanders | QB | Rushing Yards | 127 |
| Michael Penix Jr. | Falcons | QB | Passing Yards / TD | 223 / 1 |
| Bijan Robinson | Falcons | RB | Rushing Yards / TD | 90 / 2 |
| Brian Robinson Jr. | Commanders | RB | Rushing Yards | 60 |
| Drake London | Falcons | WR | Receiving Yards | 106 |
| Olamide Zaccheaus | Commanders | WR | Receiving Yards / TD | 85 / 1 |
| Zach Ertz | Commanders | TE | Receiving Yards / TD | 72 / 2 |
| Kyle Pitts | Falcons | TE | Receiving Yards / TD | 44 / 1 |
Three patterns stand out. First, the passing totals were nearly identical in December 2024 (227 yards for Daniels, 223 for Penix), yet Washington won because Daniels added 127 rushing yards. Second, Bijan Robinson has been involved in the scoring or the biggest play in both contests. Third, Washington’s red-zone and third-down efficiency has swung in unusual directions, perfect inside the 20 yet poor on third down, which signals a team that wins or loses on a handful of snaps.
Latest Updates: Where These Two Teams Stand Now
The newest information on this matchup points to a third meeting that is already on the calendar. The Falcons visit Washington on Sunday, December 20, 2026, with a 1:00 p.m. ET kickoff, so every stat above will matter again soon.
Here is what the latest data shows:
- Most recent result: Atlanta 34, Washington 27 at Mercedes-Benz Stadium on September 28, 2025.
- Previous result: Washington 30, Atlanta 24 in overtime on December 29, 2024.
- Washington’s current form: The Commanders sit at 1-4-1 in the latest NFC East standings, with recent results including a 23-17 loss at San Francisco and a 27-27 tie against the New York Giants.
- Atlanta’s current form: The Falcons hold a 3-4 record after a 29-20 home win over San Francisco, following a high-scoring stretch that included a 45-24 victory at New Orleans.
- Upcoming game: Atlanta travels to Washington on December 20, 2026, giving both teams a chance to rewrite the narrative of the past two seasons.
Records and rosters change from week to week, so check injury reports and the official depth charts before kickoff. Quarterback availability in particular will shape which version of these stats is relevant in the next game.
What These Numbers Mean Going Forward
A single game is a snapshot, but patterns across two meetings reveal where each side needs to improve.
For Atlanta, the lesson is that explosive passing produces points even when the rushing game averages only 3.5 yards per carry. Penix’s efficiency, London’s contested-catch ability and Robinson’s versatility form a core that has troubled Washington twice. The Falcons’ vulnerability is consistency: they scored 34 points but still needed a late field goal to hold on.
For Washington, third-down conversion and sustained drives are the priority. Converting only one of eight third downs hands the opponent more than 34 minutes of possession, and that is difficult to overcome even with excellent kicking. The Commanders also need a healthy Daniels. The December 2024 box score shows how dangerous the offense becomes when he can both throw and run.
For fans following the series, the most useful approach is to track three numbers in the next meeting: third-down success rate, yards per pass attempt and total scrimmage yards for Robinson. Those numbers show quickly which offense is controlling the game.
The Final Word on Washington Commanders vs Atlanta Falcons Player Stats
Numbers never replace watching the game, but they come closer to the truth than a final score ever will. The Washington Commanders vs Atlanta Falcons match player stats from the latest meeting show a Falcons offense that won through efficiency and big plays, and a Commanders team that stayed competitive through kicking, short-field scrambles and a late touchdown push.
If you support Washington, the encouraging signs are the fourth-quarter fight and the evidence from December 2024 that a healthy Daniels changes the math. If you back Atlanta, the passing numbers from Penix, London, Pitts and Robinson show an offense capable of beating almost any defense.
With the next meeting set for December 20, 2026, these stats offer a ready-made scouting guide. Watch the quarterbacks, watch third down and watch who controls the clock. Those three factors have decided this matchup more than anything else.